extend-namespace-01-f
|
|
SVG Image
|
PNG Image
|
|
extend-namespace-01-f
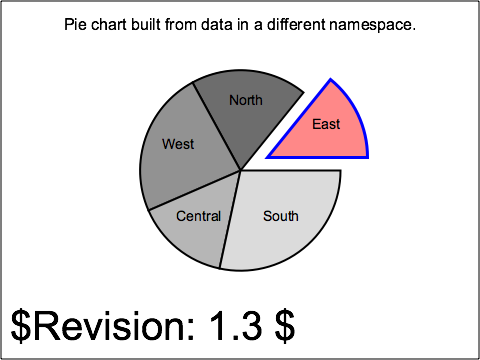
Test the use of multiple namespaces.
var svg_ns = "http://www.w3.org/2000/svg";
var bd_ns = "http://example.org/ExampleBusinessData";
function onLoad(evt){
// Get Document
var svgElement = evt.target;
var doc = svgElement.ownerDocument;
var resultsElement = doc.getElementById('results');
var gElement = doc.getElementById('PieParent');
// Count the number of regions.
RegionNodeList = doc.getElementsByTagNameNS(bd_ns, "Region");
regionCount = RegionNodeList.length;
// Get the region data.
RegionNameNodeList = doc.getElementsByTagNameNS(bd_ns, "RegionName");
RegionResultNodeList = doc.getElementsByTagNameNS(bd_ns, "RegionResult");
// Get the sum of the values of the regions.
var total = 0;
for (regionIndex = 0; regionIndex < regionCount; regionIndex++)
total = total + Number(RegionResultNodeList.item(regionIndex).firstChild.nodeValue);
// Build a pie chart.
var startAngle = 0;
for (regionIndex = 0; regionIndex < regionCount; regionIndex++) {
regionName = RegionNameNodeList.item(regionIndex).firstChild.nodeValue;
regionResult = Number(RegionResultNodeList.item(regionIndex).firstChild.nodeValue);
// Build the pie slice.
textElement = doc.createElementNS(svg_ns, "text");
textNode = doc.createTextNode(regionName);
textElement.appendChild(textNode);
pathElement = doc.createElementNS(svg_ns, "path");
endAngle = startAngle - regionResult * Math.PI * 2 / total;
dAttribute = "M240,170 L";
gray = Math.round(Number(255 * (regionIndex+2)) / (regionCount+2));
midAngle = (startAngle + endAngle) / 2;
textElement.setAttributeNS(null, "x", Math.round(240+65*Math.cos(midAngle)));
textElement.setAttributeNS(null, "y", Math.round(170+65*Math.sin(midAngle)));
dAttribute = dAttribute + Math.round(240+100*Math.cos(startAngle));
dAttribute = dAttribute + ',';
dAttribute = dAttribute + Math.round(170+100*Math.sin(startAngle));
dAttribute = dAttribute + ' A100,100 0 0,0 ';
dAttribute = dAttribute + Math.round(240+100*Math.cos(endAngle));
dAttribute = dAttribute + ',';
dAttribute = dAttribute + Math.round(170+100*Math.sin(endAngle));
dAttribute = dAttribute + 'z';
pathElement.setAttributeNS(null, "d", dAttribute);
pathElement.setAttributeNS(null, "fill", "rgb("+gray+","+gray+","+gray+")");
pathElement.setAttributeNS(null, "stroke", "black");
pathElement.setAttributeNS(null, "stroke-width", "2");
// Temporary, for CSS styling.
pathElement.setAttributeNS(null, "fill", "rgb("+gray+","+gray+","+gray+")");
pathElement.setAttributeNS(null, "stroke", "black");
pathElement.setAttributeNS(null, "stroke-width", "2");
if (regionIndex == 0) {
var firstSliceOffset = 30;
var transformValue = "translate(" +
Math.round(firstSliceOffset * Math.cos(midAngle)) +
"," +
Math.round(firstSliceOffset * Math.sin(midAngle)) +
")";
pathElement.setAttributeNS(null, "transform", transformValue);
textElement.setAttributeNS(null, "transform", transformValue);
pathElement.setAttributeNS(null, "fill", "#FF6666");
pathElement.setAttributeNS(null, "stroke", "#0000FF");
pathElement.setAttributeNS(null, "stroke-width", "3");
// Temporary, for CSS styling.
pathElement.setAttributeNS(null, "fill", "#FF8888");
pathElement.setAttributeNS(null, "stroke", "#0000FF");
pathElement.setAttributeNS(null, "stroke-width", "3");
}
gElement.appendChild(pathElement);
gElement.appendChild(textElement);
startAngle = endAngle;
}
}
East
3
North
4
West
5
Central
3.2
South
6
Pie chart built from data in a different namespace.
Pie chart is built within this 'g' element
$Revision: 1.3 $
|
|
|